
telemetry.dev
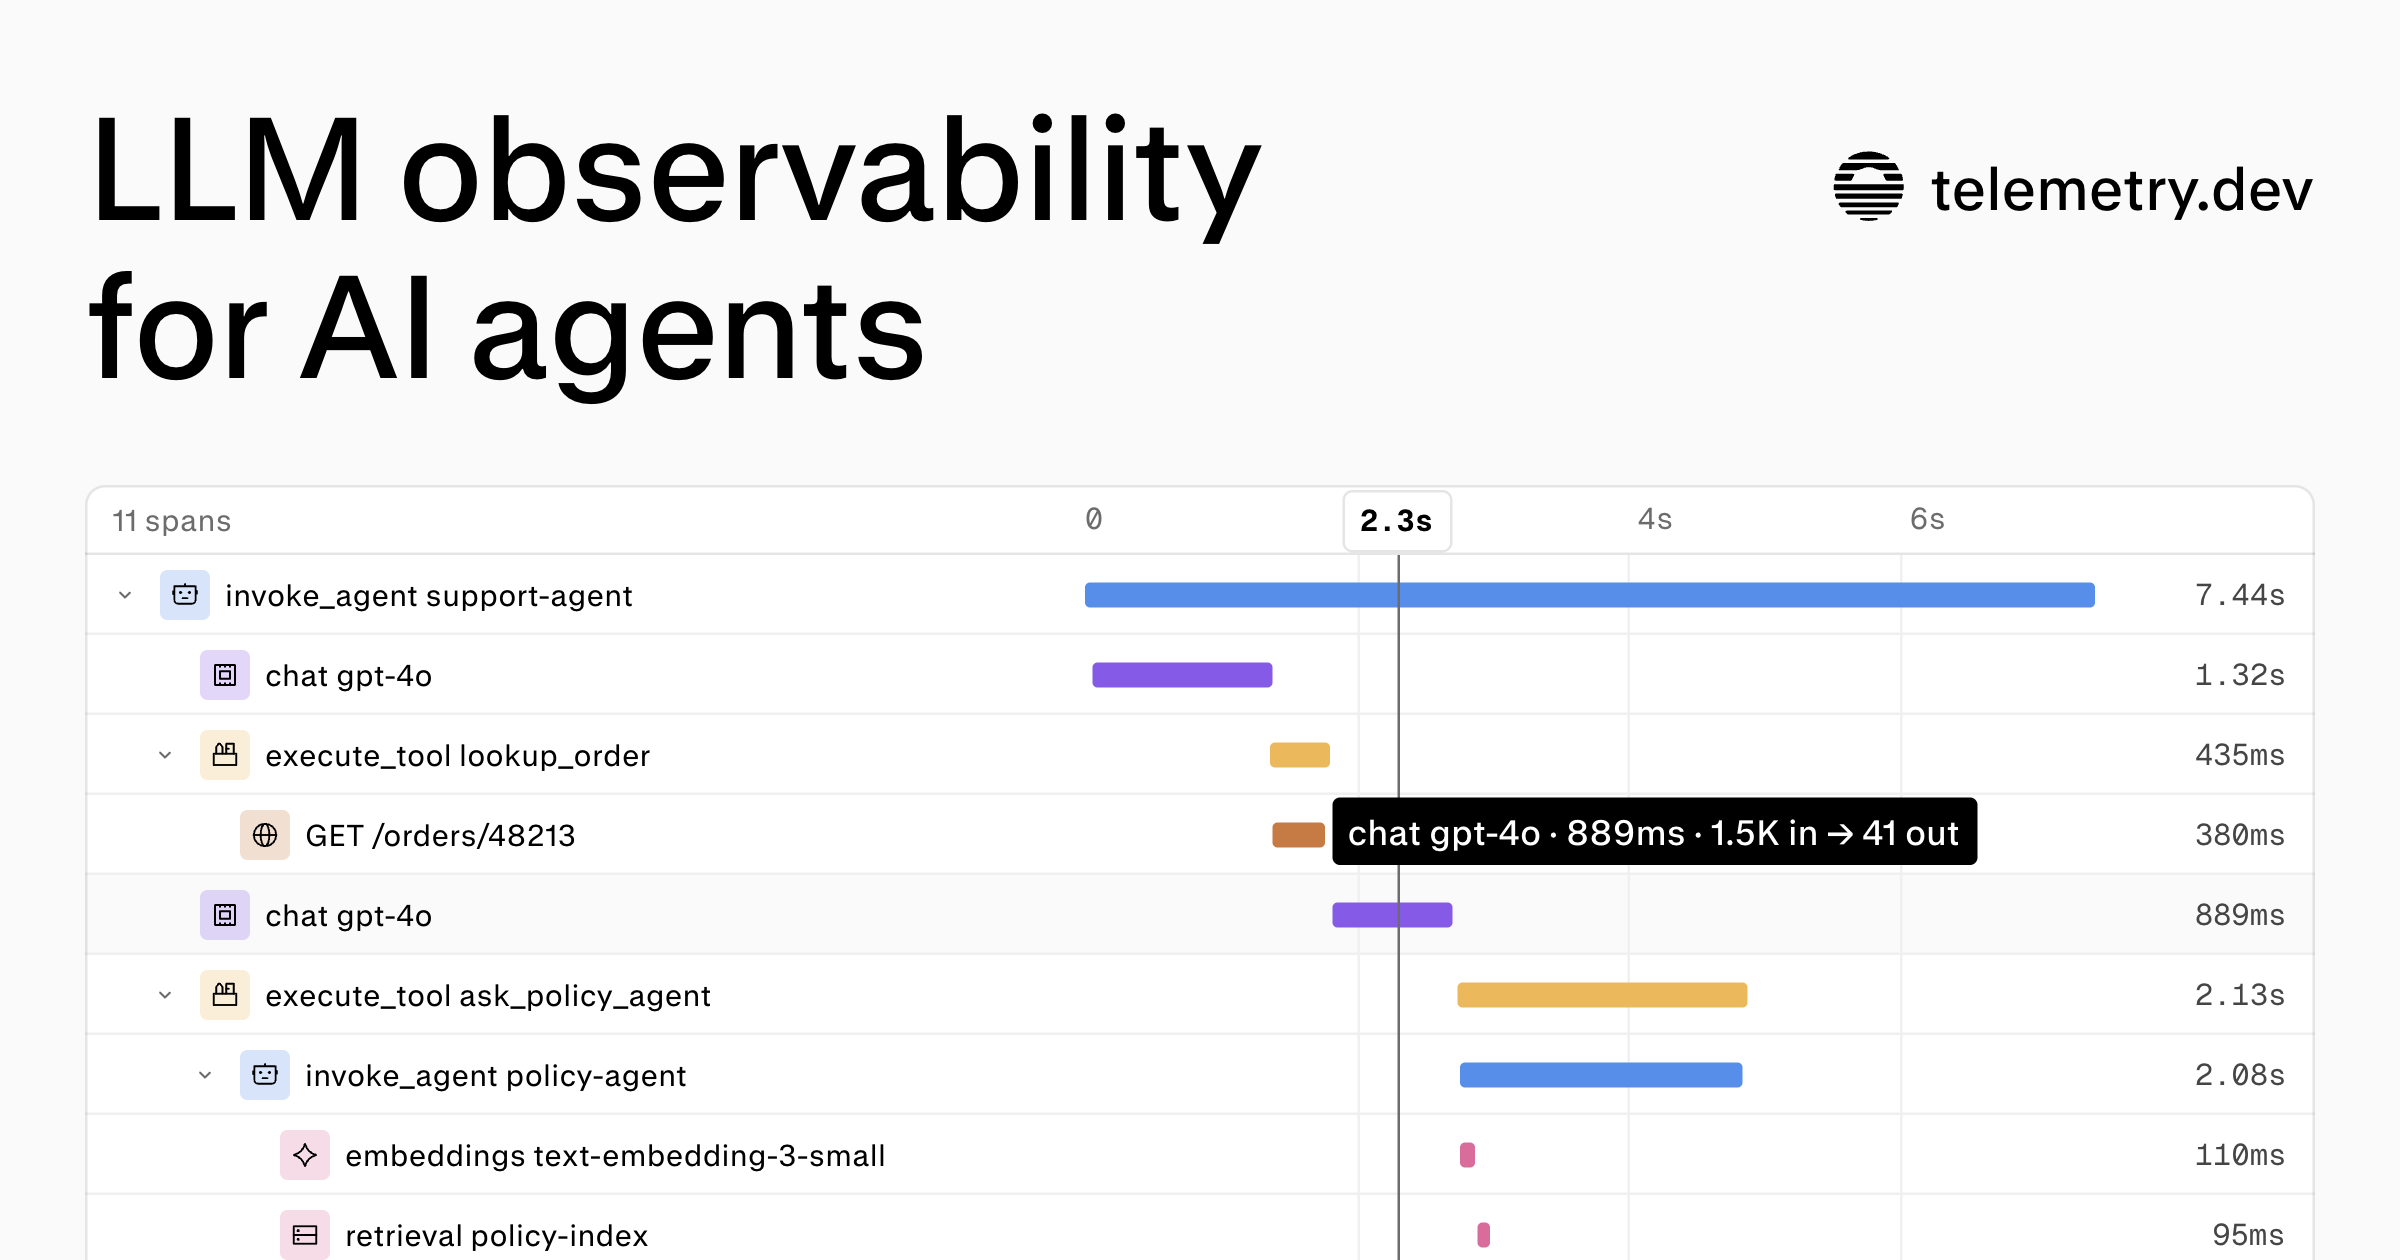
telemetry.dev traces AI application and agent model calls, tool steps, and retrievals so engineering teams can investigate failures and monitor latency, token usage, and cost.
Who it's for
- AI application engineers instrumenting TypeScript or Python services who need traces across model calls, tools, and retrievals.
- Platform or observability teams already exporting OpenTelemetry data over OTLP/HTTP that want AI-specific trace, cost, and error views.
- Teams running MCP tools or AI agents that need visibility into MCP methods, failures, and call durations.
Not the right fit if…
- Teams that need to prevent sensitive content from being transmitted to telemetry.dev: disabling prompt capture does not stop transmission, so the page says to remove sensitive content in instrumentation before export.
How it fits your workflow
Create a project API key and instrument the application with the TypeScript or Python SDK, a listed integration, or an existing OTLP/HTTP exporter. Run an instrumented request to send its telemetry.
Open the trace in the project to inspect model calls, tool steps, retrievals, duration, token usage, cost, and errors. Search or filter traces by name, status, environment, framework, or session.
Configure alerts for cost, budgets, agent loops, or model and tool errors. For supported prompt, response, and tool-payload fields, adjust capture by environment before storage.
Pricing
Free: The free plan costs $0 and includes 30,000 ingestion units per month, 14-day retention, one project, and two seats, with no credit card required. Each normalized span, OTLP log record, or metric data point uses one ingestion unit.
Free
$0
- · 30,000 ingestion units per month
- · 14-day retention
- · One project
- · Two seats
Prices checked on Oct 31, 2026 from the vendor's site. They can change; confirm before you buy.
Key features
- End-to-end traces
- View model calls, tool steps, and retrievals together in a trace, with durations and trace attributes to help locate slow or failed steps.
- Cost and usage monitoring
- Review token usage, cost, latency, and errors, with comparisons by model, provider, and environment.
- Trace search and filtering
- Search by name or filter traces by status, environment, framework, or session.
- MCP analytics
- Inspect MCP traffic for methods, tools, and failures, including spans, failed-call rates, and p95 duration.
- Alerts
- Set email alerts for cost, budgets, agent loops, and model or tool errors.
- Prompt management
- Manage prompt versions, labels, and rollouts without a deploy.
Works with
- TypeScript SDK
- Python SDK
- OpenTelemetry and OTLP/HTTP
- OpenAI
- Anthropic and Claude
- Vercel AI SDK
- Other listed providers and frameworks
- Model Context Protocol
Limitations to know
- The free plan includes 30,000 ingestion units per month, 14-day retention, one project, and two seats.
- Trace detail depends on what the application's instrumentation emits.
- Without matching model pricing or reported token usage, computed cost is unavailable.
- Disabling prompt capture does not stop data transmission to ingest and does not remove arbitrary content from logs, errors, or custom attributes.
- Redaction pattern matching cannot catch all sensitive data.
Alternatives to consider
-
LangWatch
Choose it if you need realistic simulations, testing, red-teaming, and governance alongside agent traces.
-
HoneyHive
Choose it if you need live and offline evaluations or human-in-the-loop review in addition to production tracing.
-
Helicone
Choose it if routing LLM requests through an AI gateway is part of the job as well as debugging and monitoring them.
Getting started
npm install @telemetry-dev/sdkA project API key and an instrumented application using a telemetry.dev integration or an OTLP/HTTP exporter. First-party SDKs are listed for TypeScript and Python.
- Create a project API key.
- Choose a telemetry.dev integration or configure an OTLP/HTTP exporter for your application.
- Run an instrumented request to send a trace.
- Open the trace in your project.
Frequently asked questions
What is telemetry.dev?
It is an LLM observability platform for AI applications and agents, built on OpenTelemetry. A trace groups instrumented model calls, tool steps, and retrievals in a request or agent run; reported token usage, cost, latency, and errors help with debugging and spend monitoring.
How do I start sending traces?
Make a project API key, configure a telemetry.dev integration or an OTLP/HTTP exporter, run an instrumented request, and open its trace in your project.
Which frameworks and languages are supported?
The page identifies first-party TypeScript and Python SDKs and integrations for providers and frameworks including OpenAI, Anthropic, and Vercel AI SDK. Claude SDK and Claude API can send native OpenTelemetry spans, and other languages can send standard OTLP over HTTP. Trace detail depends on what the instrumentation emits.
How is cost calculated?
Cost is calculated at ingest from reported token usage and the model-pricing catalog. Cache-read and cache-write tokens use separate rates when available; reasoning tokens are not charged separately. An explicit span cost takes precedence, and computed cost is unavailable without matching model pricing or token usage.
Can I keep prompts and completions out of storage?
For recognized prompt, response, and tool-payload fields, capture can be disabled per environment before storage. Capture is on by default. Disabling it does not stop transmission to ingest or remove arbitrary content from logs, errors, or custom attributes. Built-in and project-specific redaction patterns are available, but pattern matching may not catch all sensitive data; remove sensitive content in instrumentation before export to prevent transmission.