
MyLens AI
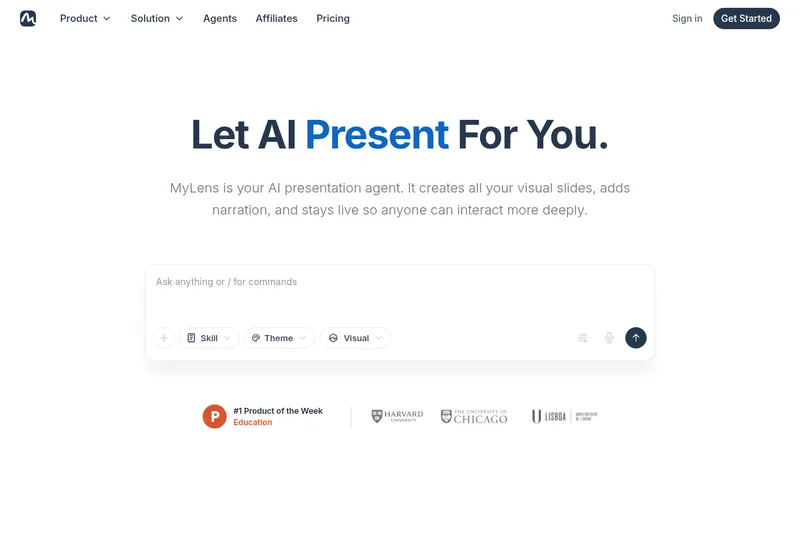
MyLens turns documents, links, spreadsheets, videos, images, or ideas into editable interactive presentations with AI narration. Educators, consultants, analysts, and marketing teams can share visual explanations and source citations with an audience.
One of 143 tools in Research
Who it's for
- Educators who need to turn notes and source materials into presentations for teaching.
- Consultants and analysts presenting reports, research, or other dense source material.
- Marketing teams creating client-facing visual content in a brand theme.
How it fits your workflow
Provide documents, slides, links, videos, images, CSV or Excel files, Google Drive content, or a description of the presentation you want. MyLens identifies key information and structures it into visual slides.
Choose an AI agent and theme, select visuals, then refine the generated presentation. The page says presentations remain editable, including their text, visuals, and themes.
Add AI narration if needed, then share a live link, download visuals as images, or embed the interactive presentation. Viewers can click into slides for explanations, citations, and other details.
Pricing
Free: You can start for free, explore key features, and add the Chrome extension at no cost.
Free
Free
- · Start for free and explore key features
- · Free Chrome extension
Paid / Upgrade
Not specified on page; upgrade available
- · Advanced options unlocked by upgrading (details not listed on page)
Prices checked on Jul 15, 2026 from the vendor's site. They can change; confirm before you buy.
Key features
- Interactive Exploration
- Visualizations are fully interactive: click, expand, or drill into any part to uncover deeper insights; every element is explorable.
- Source Traceability & Citations
- Every insight in a visualization is traceable back to its original source with verifiable citations for full transparency.
- AI-powered Insight Extraction
- AI analyzes dense content to identify key insights, suggest deeper connections, and highlight things users might miss by reading raw text.
- Multi-format Input Support
- Supports text, PDFs, Word & PowerPoint files, webpages and Notion pages, YouTube links, images/screenshots, CSV/Excel data, and long pasted text.
- Customization & Export
- Users can personalize visuals (content, colors, fonts, layouts) and download images, share links, or embed interactive visuals into documents or websites.
- Chrome Extension
- A Chrome Extension converts webpages, dashboards, news, social media, private portals, and YouTube into dynamic visualizations with one click.
Works with
- Chrome Extension
- YouTube
- Notion & Webpages
- CSV / Excel
Limitations to know
- The page does not state plan prices or specify which advanced options and higher limits require an upgrade.
Alternatives to consider
-
SlideSpeak
Choose it if you need native PowerPoint (.pptx) output, an AI editor, or an API for teams and enterprises.
-
Presentations.AI
Choose it if you need on-brand PowerPoint slide decks, data-driven updates at scale, or API and white-label options.
Getting started
- Start with the Get Started or Start free option.
- Upload or connect source material, paste a link, or describe the presentation you want to create.
- Choose an agent and theme, then review and refine the generated presentation.
- Add narration if needed and share, download, or embed the result.
Frequently asked questions
What is MyLens AI?
MyLens turns complex or scattered information into clear, interactive visuals — like mind maps, timelines, tables, or charts — highlighting structure, key ideas, and relationships from text, files, or data.
What is dynamic visualization?
Dynamic visualizations are interactive, AI-powered visuals that adapt and respond to your interactions and remain connected to original sources, allowing exploration, expansion, and drilling into information.
Can I edit the visualizations created by MyLens?
Yes. Every visualization is fully editable — you can tweak content, colors, and layouts or ask AI to refine specific sections.
Can I share or export the visualizations?
Yes. You can download visualizations as images, share links, or embed interactive versions into documents, websites, or presentations.
Does MyLens have a Chrome Extension?
Yes. The MyLens Chrome Extension lets you turn any webpage — from articles and dashboards to YouTube videos — into dynamic visualizations with one click.
Can I try MyLens for free?
Yes. You can start for free, explore key features, and upgrade anytime to unlock advanced options.