
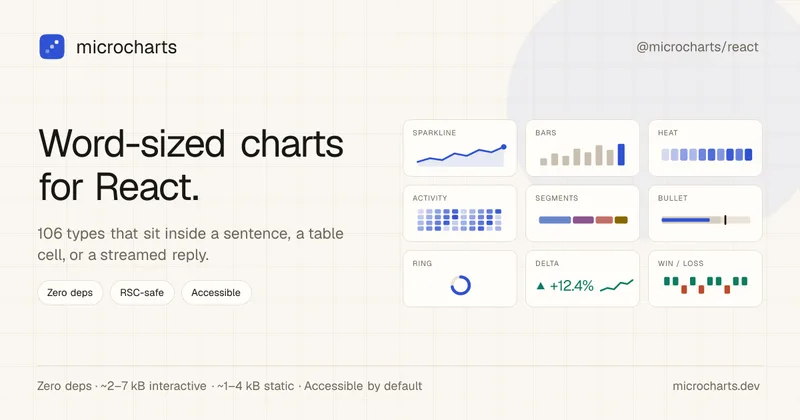
Tiny React charts that fit in a line of text, zero deps
microcharts is a zero-dependency React library of word-sized charts and sparklines (106 chart types) designed to fit inside a sentence, table cell, or streamed assistant reply. It emphasizes tiny bundle size, accessibility, theming, and AI-friendly machine-readable surfaces.
Tiny React charts that fit in a line of text, zero deps is business intelligence software teams evaluate for creative & design. Use this page to review pricing, integration signals, and the best alternatives before you commit.
Profile facts come from the vendor source. AiMatch labels unknown pricing or API details instead of estimating them.
Review official source →Used in These Packs
Quick Overview
Best for: Creative & Design
What it does
Business Intelligence software for decision-makers comparing workflow fit and alternatives.
Best fit
Creative & Design
Pricing snapshot
Free from Free
Next step
Compare Tiny React charts that fit in a line of text, zero deps with similar tools before you shortlist it.
Compare this tool before you shortlist it
Review alternatives, pricing posture, and workflow fit side by side.
microcharts is a React library of word-sized charts and sparklines built to render legibly inside a sentence, table cell, KPI card, or streamed assistant reply. The project provides 106 compact chart types with an emphasis on extremely small client cost (interactive charts ~2.17–6.75 kB gzip, static SVGs from 1 kB), zero runtime dependencies, and accessibility by default. It targets developers building text-first UIs, model-driven surfaces, dashboards where space is constrained, and server-rendered pages (RSC-safe) that may ship no client JS. The library includes machine-readable catalog and prompt-ready documentation so models and agents can emit the typed chart blocks directly.
Word-sized React charts — tiny sparklines, micro charts & inline SVG trend lines. Zero runtime deps, ~2–7 kB interactive · ~1–4 kB static, accessible by default, RSC-safe. Sit in a sentence, table cell, KPI card, or AI reply.
Own this listing?
Claim this page for a one-time $29 to add pricing, features, screenshots, verified owner details, and a clearly labeled 30-day category position after the profile is live.
Claim this listing for $29Key Features
Zero runtime dependencies
The library advertises dependencies: {} and React as a peer dependency, enabling minimal bundle impact and easy inclusion in projects.
106 word-sized chart types
A catalog of 106 compact chart types (sparklines, mini bars, heat strips, horizon, seismogram, etc.) optimized to fit in a line of text, table cell, or inline UI.
Tiny bundle cost
Interactive charts are CI-enforced at roughly 2.17–6.75 kB gzip per chart (median 5.07 kB); static SVG marks can be as small as ~1 kB.
Accessibility by default
Charts are role="img" with an accessible name generated from the data, keyboard-focusable with arrow navigation and polite live-region updates, and respect prefers-reduced-motion, forced-colors, and prefers-contrast.
AI-native and machine surfaces
Machine-friendly assets (llms.txt, llms-full.txt, catalog.json, agent-setup.md) and conventions let models and agents emit chart blocks directly into text streams or assistant replies.
Server Components & static SVG output
Supports rendering as pure SVG in React Server Components so static routes can ship no chart JS at all; an npx helper produces finished SVGs for surfaces that can’t run React.
Theming and color accessibility
defineTheme derives a color-blind-safe palette and matched dark variants from a single brand color; presets and CSS custom properties let charts re-theme consistently.
Robust to bad input
Hostile inputs such as NaN, Infinity, or empty arrays render sensible fallbacks (e.g., “No data.” or single-value messaging) rather than crashing.
Pricing
MIT-licensed open-source library; free to use.
Open source (MIT)
Free- MIT license
- Zero runtime dependencies
- Full docs and example apps
Use Cases
Inline charts in prose and tables
Embed sparklines and micro charts inside sentences, table cells, KPI cards, and editorial copy where space is extremely limited.
Assistant/model replies and streamed output
Models and chat assistants can emit typed chart blocks mid-reply; a plain-text reply becomes a shipped component when the chart fence closes.
Server-rendered dashboards and analytics
Use in RSC/Server Components to render product analytics or service-health visuals with minimal client payload.
Developer tooling and scaffolded components
Coding agents, IDE integrations and scaffolding tools can output chart code from the typed catalog (examples: Cursor, Claude Code, Copilot integrations listed).
Compact trading and operations consoles
Examples include a night-session trading terminal and a service-health console where dense, word-sized marks communicate state quickly.
Print and editorial design
Presets and static SVG output enable small inline charts suitable for print or editorial placements where visual economy matters.
Integrations
Chat assistants & models
Documented compatibility with model outputs and assistants such as Claude, ChatGPT, Gemini, Grok, Perplexity, Qwen, and others that can emit chart blocks.
Frameworks & SDKs
Mentioned integrations for scaffolding and tool mapping including Vercel AI SDK, OpenAI Agents, LangChain, Anthropic SDK, and Hugging Face.
npx microcharts helper
npx -y @microcharts/mcp produces finished SVGs (find_microchart, get_microchart, render_microchart) for surfaces that can’t run React.
Benefits
Limitations
Frequently Asked Questions
No verified FAQs are available.
Getting Started
- 1 Install the package: pnpm add @microcharts/react
- 2 Add a tiny chart inline (example from docs): <Sparkline title="Weekly revenue" data={[132,148,141,165,159,182,176,203]} curve="smooth" />
- 3 Read the quickstart and catalog to learn chart types and props (see the docs and catalog.json for machine-readable shapes)
Support
docs
Documentation and quickstart on the site (Docs / Quickstart / Catalog).
examples
Seven live example apps demonstrating every chart type (links available from the site).
repo & package
Package pages (npm) and project repository references available from the site footer (GitHub / npm links shown on the site).
API
https://microcharts.dev/docs
Compare Tiny React charts that fit in a line of text, zero deps with similar tools
See how it stacks up against alternatives
Related Tools
View all 198 →
DeepSQL
DeepSQL is a self‑hosted, 24/7 automated DBA and data engineering assistant that monitors database workloads, optimizes slow queries, and ships BI dashboards. It provides a built-in agent, CLI/MCP server, and Slack integration to let teams query, analyze, and put databases on autopilot while keeping data inside their VPC.
Strata
Strata is a business intelligence platform combining governed semantic modeling, self-service dashboards, AI analytics agents, and federated OLAP routing. It helps data teams and business users explore warehouse data while keeping queries grounded in a governed model.



Data Storytelling Platform
Datastory is an AI-assisted data visualization and storytelling platform for turning uploaded, linked, or catalog data into annotated charts and publishable narratives. Users can share work as standalone links, website embeds, or high-quality images.

VisiScan
VisiScan is an AI visibility scanner that runs live queries across ChatGPT, Claude, Perplexity and Gemini to show whether AI answer engines name your business, who your competitors are in AI answers, and provides prioritized, ready-to-publish fixes to improve AI visibility.
Premium Alternatives

Prisync
Prisync is an AI-powered competitor price tracking, monitoring, and dynamic pricing SaaS that helps ecommerce sellers, brands and suppliers monitor competitor prices across channels (Shopify, Amazon, Google Shopping, marketplaces), enforce MAP, and automate price adjustments to optimize profitability.

Portals.co
Portals.co is an AI-powered customer feedback platform that uses website popups and linkable forms to collect feedback, ask AI-drafted follow-up questions, and analyze responses into actionable insights.
Jeda.ai
Jeda.ai is a patented Visual AI Workspace that combines multi-LLM reasoning, 300+ analytical frameworks, and an infinite collaborative canvas to transform prompts, documents, and datasets into framework-grounded visual outputs (matrices, mind maps, flowcharts, infographics) for teams and enterprises.

Documentpro
DocumentPro is an API-first document intelligence platform that extracts structured data from invoices, purchase orders, tax forms and other documents for embedding into software platforms; it emphasizes fast integration, AI-powered extraction, and maintenance-free production operation.

Helium 10
Helium 10 is an e-commerce seller software suite for researching products and keywords, optimizing listings, managing operations, and analyzing advertising and sales across Amazon, Walmart, and TikTok Shop. Its Helium AI agent and MCP connection help sellers ask questions about their business and use Helium 10 data in external AI tools.


Predict Expert AI
Predict Expert AI is a B2B-focused AI company that builds tailored AI models, web/mobile apps, chatbots, automation workflows, forecast models and API integrations to deliver generative and predictive intelligence and real-time operational insights for businesses.
Usesaaskit
useSAASkit is a Next.js and React Native SaaS boilerplate that bundles AI-ready code (Vercel AI SDK), authentication, multi-organization support, admin tools, billing, marketing pages, analytics and i18n to help founders launch AI-powered SaaS and mobile apps quickly.