

Graphy
Graphy is an AI-powered data visualization tool that automatically ingests messy data and generates clear, publication-ready charts and narrative insights for teams, reports, social posts, and embeds.
Graphy is data visualization software teams evaluate for business intelligence. Use this page to review pricing, integration signals, and the best alternatives before you commit.
Profile facts come from the vendor source. AiMatch labels unknown pricing or API details instead of estimating them.
Review official source →Used in These Packs
Quick Overview
Best for: Business Intelligence
What it does
Data Visualization software for decision-makers comparing workflow fit and alternatives.
Best fit
Business Intelligence
Pricing snapshot
Free
Next step
Compare Graphy with similar tools before you shortlist it.
Compare this tool before you shortlist it
Review alternatives, pricing posture, and workflow fit side by side.
Graphy is an AI Graph Maker that transforms messy datasets into clear, styled charts and story-driven insights. It targets teams and creators who need to communicate data quickly — supporting live Google Sheets, CSV/Excel uploads, pasted values, API ingestion, or AI data search. Graphy automatically suggests the clearest visualizations, provides headline takeaways, allows branding (colors, fonts, annotations), and supports exporting or embedding charts for slides, social posts, docs, and reports. The site highlights usage by professional teams and claims a community of 300,000+ data storytellers.
Graphy is a fast and collaborative data visualization platform that transforms messy data into clean, branded, presentation-ready graphs with built-in storytelling features.
Own this listing?
Claim this page for a one-time $29 to add pricing, features, screenshots, verified owner details, and a clearly labeled 30-day category position after the profile is live.
Claim this listing for $29Key Features
AI-driven chart suggestions & insights
An AI data engine inspects rows and returns the three clearest charts along with headline takeaways and visible reasoning.
Multiple data ingestion methods
Link a live Google Sheet, upload CSV or Excel files, paste or type values, call the API, or ask AI to search for data.
Chat with your data
Prompt the product to get the right chart, insight, or answer in seconds and fine-tune results interactively.
Branding & styling
Instantly apply brand colors, fonts, and styles to all charts and add annotations to highlight key points.
Export & embed
Export visualizations for slides, social posts, docs, or embed them where needed.
Variety of chart types
Offers many chart types (horizontal/stacked bars, lines, funnels, tables, heatmaps, pies, time series, Likert scales, etc.)
API access & live updates
Supports API ingestion and can keep charts updated live.
Pricing
Start for free — the site advertises a free starting option but specific paid tiers and pricing details are not listed on the provided content.
Use Cases
Internal reporting & board memos
Create polished charts and narrative insights for internal reports and executive summaries quickly.
Marketing & social content
Produce visuals optimized for social posts, newsletters, and external communications.
Embedded analytics & docs
Embed charts into docs or product pages to give teams and stakeholders clear, contextualized data where they work.
Automated updates & dashboards
Keep teams aligned with live/updating charts without sending stakeholders to a full BI dashboard.
Integrations
Google Sheets
Link a live Google Sheet as a data source.
CSV / Excel import
Upload CSV or Excel files to ingest data.
API
Call Graphy’s API to push or pull data programmatically.
Embeds & social platforms
Export or embed charts and share visuals to platforms like LinkedIn, TikTok, X (Twitter), YouTube, and Instagram (platforms listed on the site).
Benefits
Limitations
No verified limitations are available.
Frequently Asked Questions
No verified FAQs are available.
Getting Started
- 1 Step 1: Sign up or Start for free on the Graphy site
- 2 Step 2: Add your data (link a Google Sheet, upload CSV/Excel, paste values, or call the API)
- 3 Step 3: Let Graphy’s AI inspect the data to generate suggested charts and headline insights, then brand and export or embed the visuals
Support
No verified support channels are available.
API
Compare Graphy with similar tools
See how it stacks up against alternatives
Related Tools
View all 195 →
DeepSQL
DeepSQL is a self‑hosted, 24/7 automated DBA and data engineering assistant that monitors database workloads, optimizes slow queries, and ships BI dashboards. It provides a built-in agent, CLI/MCP server, and Slack integration to let teams query, analyze, and put databases on autopilot while keeping data inside their VPC.
Strata
Strata is a business intelligence platform combining governed semantic modeling, self-service dashboards, AI analytics agents, and federated OLAP routing. It helps data teams and business users explore warehouse data while keeping queries grounded in a governed model.

Tiny React charts that fit in a line of text, zero deps
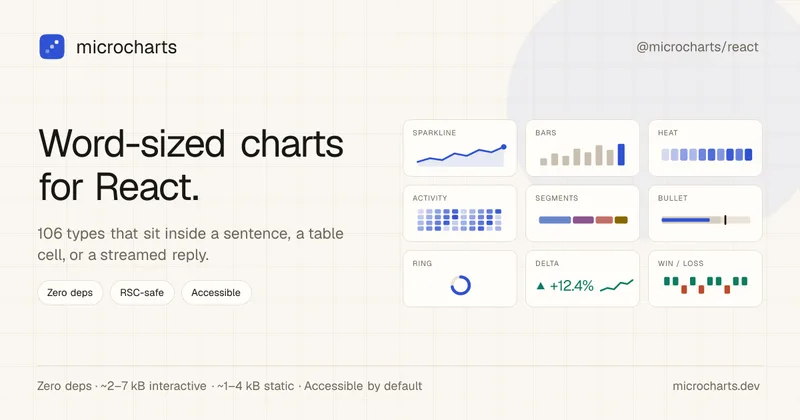
microcharts is a zero-dependency React library of word-sized charts and sparklines (106 chart types) designed to fit inside a sentence, table cell, or streamed assistant reply. It emphasizes tiny bundle size, accessibility, theming, and AI-friendly machine-readable surfaces.


Data Storytelling Platform
Datastory is an AI-assisted data visualization and storytelling platform for turning uploaded, linked, or catalog data into annotated charts and publishable narratives. Users can share work as standalone links, website embeds, or high-quality images.

VisiScan
VisiScan is an AI visibility scanner that runs live queries across ChatGPT, Claude, Perplexity and Gemini to show whether AI answer engines name your business, who your competitors are in AI answers, and provides prioritized, ready-to-publish fixes to improve AI visibility.
Premium Alternatives


Prisync
Prisync is an AI-powered competitor price tracking, monitoring, and dynamic pricing SaaS that helps ecommerce sellers, brands and suppliers monitor competitor prices across channels (Shopify, Amazon, Google Shopping, marketplaces), enforce MAP, and automate price adjustments to optimize profitability.

Documentpro
DocumentPro is an API-first document intelligence platform that extracts structured data from invoices, purchase orders, tax forms and other documents for embedding into software platforms; it emphasizes fast integration, AI-powered extraction, and maintenance-free production operation.

Jeda.ai
Jeda.ai is a patented Visual AI Workspace that combines multi-LLM reasoning, 300+ analytical frameworks, and an infinite collaborative canvas to transform prompts, documents, and datasets into framework-grounded visual outputs (matrices, mind maps, flowcharts, infographics) for teams and enterprises.

Predict Expert AI
Predict Expert AI is a B2B-focused AI company that builds tailored AI models, web/mobile apps, chatbots, automation workflows, forecast models and API integrations to deliver generative and predictive intelligence and real-time operational insights for businesses.
Usesaaskit
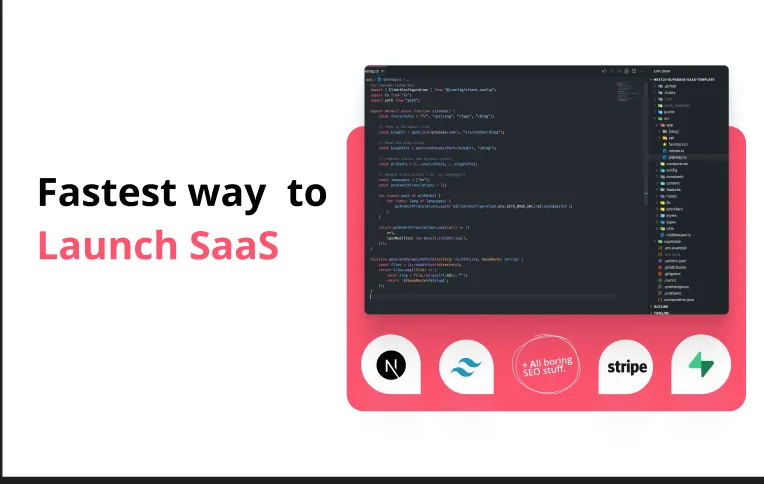
useSAASkit is a Next.js and React Native SaaS boilerplate that bundles AI-ready code (Vercel AI SDK), authentication, multi-organization support, admin tools, billing, marketing pages, analytics and i18n to help founders launch AI-powered SaaS and mobile apps quickly.

Helium 10
Helium 10 is an e-commerce seller software suite for researching products and keywords, optimizing listings, managing operations, and analyzing advertising and sales across Amazon, Walmart, and TikTok Shop. Its Helium AI agent and MCP connection help sellers ask questions about their business and use Helium 10 data in external AI tools.
