

BioRender
BioRender is a web-based scientific figure and illustration platform that helps scientists create publication-ready figures, graphs, flowcharts, protocols, timelines and slides using a large library of scientifically accurate icons, templates and AI-assisted editing tools.
BioRender is research software teams evaluate for research. Use this page to review pricing, integration signals, and the best alternatives before you commit.
Profile facts come from the vendor source. AiMatch labels unknown pricing or API details instead of estimating them.
Review official source →Used in These Packs
Quick Overview
Best for: Research
What it does
Research software for decision-makers comparing workflow fit and alternatives.
Best fit
Research
Pricing snapshot
Freemium from Free (Sign Up Free)
Next step
Compare BioRender with similar tools before you shortlist it.
Compare this tool before you shortlist it
Review alternatives, pricing posture, and workflow fit side by side.
BioRender is a browser-based tool for creating professional, publication-ready scientific figures, graphs, and slides using a large library of scientifically accurate icons and templates. It targets scientists, research labs, and industry teams, offering editable AI-assisted figure generation and conversion of images or written methods into clean, editable visuals. The platform emphasizes speed, scientific accuracy, and collaboration for use in grants, publications, presentations, and internal communication.
Create publication-ready scientific figures, graphs, and slides in minutes—no design skills needed. BioRender is a AI Tool featured on Dang.ai. Learn more about BioRender's AI tool.
Own this listing?
Claim this page for a one-time $29 to add pricing, features, screenshots, verified owner details, and a clearly labeled 30-day category position after the profile is live.
Claim this listing for $29Key Features
Editable AI Figures
Generate figures with AI that output editable elements (text, images, lines, arrows, shapes) so you can refine without starting over. (Feature labeled Beta for some capabilities.)
Image upload & conversion
Upload photos, screenshots or references and convert them into clean, editable visuals that match BioRender's style and appearance.
Fine-tune elements via text
Describe the edit you need and make precise changes to any icon or figure element to match your scientific requirements.
Flowchart generation
Convert text input into a clean, editable flowchart suitable for team workflows and presentations.
Protocol generation
Convert written methods into a clean, editable protocol first draft with layout included and ready for refinement.
Timeline creation
Describe your study to generate an editable timeline for research designs, experiment schedules, and project plans.
Graphing & data analysis
Turn raw data into publication-quality graphs by dragging and dropping Prism, CSV, or Excel files with automatic variable detection and formatting.
Large icon & template library
Access 50K+ scientifically accurate icons and thousands of customizable templates designed for scientific figures and publications.
Collaboration & workspace
Organize, edit, and review figures together in a shared workspace to streamline team workflows and versioning.
Export & presentation tools
Package visuals into posters, presentations, and other deliverables for grants, journals and internal communication.
Pricing
Sign Up Free — a free tier is available (site CTAs: 'Sign Up Free' and 'Try Graphing Free').
Free
Free (Sign Up Free)- Access to templates and basic creation tools
- Try Graphing Free
Enterprise / Industry
Contact Sales- Dedicated support and enterprise features
- Industry/organization licensing (Contact Sales)
Use Cases
Publication figures
Create publication-ready figures accepted by top journals such as Nature, Science, and Cell using vetted, scientifically accurate visuals and templates.
Grant applications
Produce clear visuals to improve grant readability and potentially increase funding success; BioRender cites higher NIH funding and improved grant outcomes in case studies.
Pharma & industry collaboration
Align teams on complex science with shared visuals and a single platform for figure creation, review, and presentation—used by top pharma companies.
Presentations & posters
Turn figures and graphs into slides, posters and other presentation formats for conferences, leadership updates, and regulatory filings.
Protocol drafting & timelines
Auto-generate protocol drafts and experimental timelines from text descriptions to accelerate experimental planning and documentation.
Integrations
Prism (GraphPad) / CSV / Excel import
Drag and drop Prism, CSV, or Excel files to import data for automated data formatting, graphing and analysis.
MCP Integrations (platform integrations)
Platform references MCP Integrations for connecting BioRender capabilities across workflows (page lists MCP Integrations).
Benefits
Limitations
Frequently Asked Questions
No verified FAQs are available.
Getting Started
- 1 Step 1: Visit the site and click 'Sign Up Free' to create an account
- 2 Step 2: Browse templates or the icon library to start a new figure
- 3 Step 3: Upload images or drag-and-drop Prism/CSV/Excel files to import data and use Graphing features
- 4 Step 4: Use AI tools to generate or edit figures, flowcharts, protocols or timelines and collaborate in the shared workspace
Support
Help center / docs
Access guides, tutorials and a Help Center from the site navigation (Help Center).
Contact sales
Contact Sales link for enterprise inquiries and licensing (Contact Sales).
Events & webinars
In-person events, webinars and virtual events listed under Resources and Engage for training and demos.
Case studies & blog
Case studies and blog content available on the site for examples, best practices and success stories.
API
Compare BioRender with similar tools
See how it stacks up against alternatives
Related Tools
View all 143 →
ThoughtDAG
ThoughtDAG is an open-source, desktop-first application that makes LLM context visible, editable, and reproducible by representing context as an editable directed acyclic graph (wires = context) and letting users preview and control exactly what the model receives.

LLM Attention Visualization
A browser-based interactive visualization that shows how transformer LLMs allocate attention to past tokens during generation by aggregating attention weights and value magnitudes across heads and layers.

PilotCite
PilotCite is a SaaS platform that helps brands monitor and improve their visibility in AI-generated answers (ChatGPT, Perplexity, Google AI, Gemini, Claude, Copilot, Grok) by tracking citations, auditing site citability, benchmarking competitors, and generating source-backed content.
Redactle LLM Leaderboard
A public benchmark dashboard that evaluates how well large language models (LLMs) solve Redactle puzzles by running standardized evaluations and publishing ranked results, costs, and performance metrics.

Knowledge graph skill for Claude/Kimi Code
SysEdge is an ontological knowledge graph and CLI for multi-agent Claude Code and Kimi Code teams that models requirements, tests, and architecture standards to surface specification, test, and standards gaps before code ships and to reduce agent orientation tokens.
HieraticBench
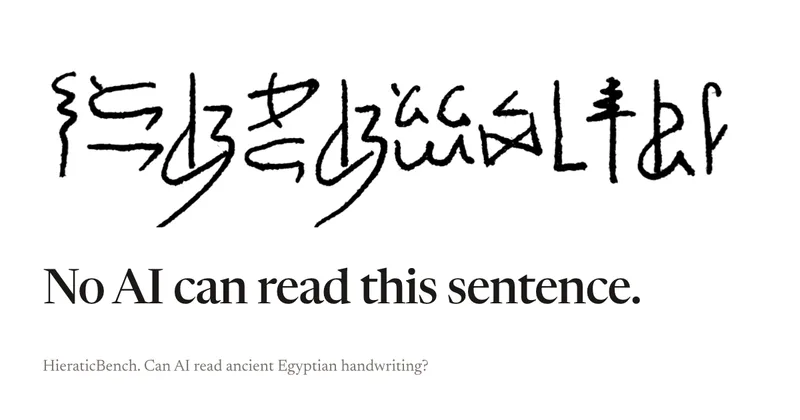
HieraticBench is an open benchmark for testing whether AI models can identify and read hieratic, the cursive handwriting of ancient Egypt. It includes a public leaderboard, evaluation harness, and dataset of documents and individual signs.
Premium Alternatives

CiteRank
CiteRank is a weekly SaaS monitoring tool that re-asks buyer questions of major AI answer engines (ChatGPT, Perplexity, Google AI Overviews, Gemini and Claude) to record whether they cite your site, name your brand, or leave you absent, and delivers board-style reports and competitor/source lists.



SermonAI
SermonAI is a web-based sermon preparation platform for pastors, combining AI-assisted research and writing with planning, sermon organization, preaching tools, and content repurposing. Its AI research can be tailored to a pastor’s denomination, Bible translation, and trusted voices.

OutlierKit
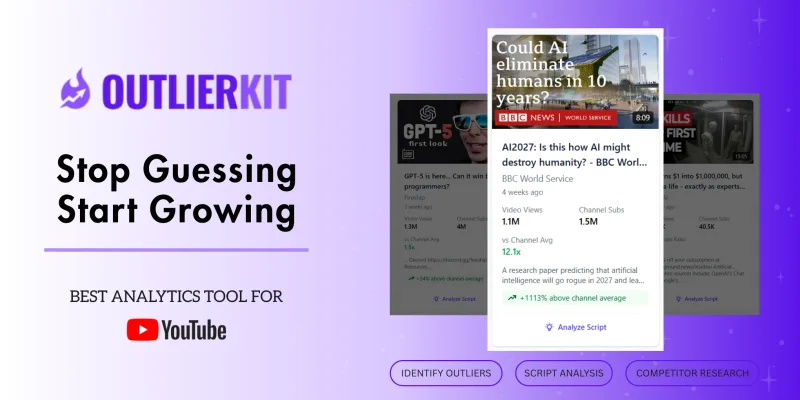
OutlierKit is a YouTube competitor analysis and outlier research platform that maps niche-wide opportunities from a single seed channel, surfaces overperforming videos, analyzes audience psychology, sponsors, and monetization, and offers AI-powered script/hook analysis and integrations for creators, teams, and agencies.

AI ChatDocs
AI ChatDocs is a GPT-4 powered document chat and summarization tool that lets users upload PDFs, Word/PPT/Docx/TXT files, websites, sitemaps and YouTube videos to generate summaries, extract references, and interactively chat with document content.